Práctica 1: Algoritmo SOM de Kohonen en una dimension
Los mapas auto-organizativos originalmente propuestos por Teuvo Kohonen se implementaron sobre redes bidimensionales. De hecho, son los mapas más utilizados porque esta dimensión permite una visualización adecuada de los clusters con un esfuerzo computacional razonable.
No obstante, los fundamentos del algoritmo de Kohonen se pueden comprender de una manera si cabe más inmediata si las neuronas forman una red unidimensional. En esta primera sección vamos a aplicar un SOM unidimesional para clasificar una colección de vectores binarios.
import numpy as np
import pandas as pd
import matplotlib.pyplot as plt
Definición de los datos
Definimos una colección de \(n_i\) vectores de entrada (instancias) de dimensión \(n_d\) formados por elementos en el conjunto \(\{0,1\}\). Un parámetro que podemos dejar libre es la proporción de cada uno de los dígitos. Usaremos una proporción de 5 a 1.
elementos = [0,1]
proporcion = [5/6,1/6]

np.random.choice(elementos,size=10,replace=True,p=proporcion)
array([0, 0, 0, 0, 1, 0, 0, 0, 0, 0])
# generamos datos iniciales

nd = 10
ni = 1000
columnas = [i for i in np.arange(nd)]
datosIniciales = pd.DataFrame(0,columns = columnas,index=np.arange(ni))
for i in np.arange(ni):
    datosIniciales.loc[i] = np.random.choice(elementos,size=10,replace=True,p=proporcion)
datosIniciales
| 0 | 1 | 2 | 3 | 4 | 5 | 6 | 7 | 8 | 9 | |
|---|---|---|---|---|---|---|---|---|---|---|
| 0 | 0 | 0 | 0 | 0 | 1 | 0 | 0 | 0 | 1 | 0 |
| 1 | 0 | 0 | 1 | 0 | 1 | 0 | 0 | 0 | 0 | 0 |
| 2 | 0 | 0 | 0 | 0 | 0 | 1 | 0 | 0 | 0 | 0 |
| 3 | 0 | 0 | 0 | 0 | 0 | 0 | 0 | 1 | 0 | 0 |
| 4 | 0 | 0 | 0 | 1 | 0 | 1 | 0 | 0 | 0 | 0 |
| ... | ... | ... | ... | ... | ... | ... | ... | ... | ... | ... |
| 995 | 0 | 0 | 0 | 0 | 0 | 0 | 0 | 1 | 0 | 1 |
| 996 | 0 | 0 | 0 | 1 | 1 | 0 | 1 | 0 | 0 | 0 |
| 997 | 0 | 0 | 0 | 1 | 0 | 1 | 0 | 0 | 0 | 0 |
| 998 | 0 | 0 | 0 | 0 | 0 | 0 | 0 | 1 | 0 | 1 |
| 999 | 0 | 0 | 0 | 0 | 1 | 0 | 0 | 0 | 0 | 0 |
1000 rows × 10 columns
# sumamos por filas
datosIniciales.sum(axis=1)
0      2
1      2
2      1
3      1
4      2
      ..
995    2
996    3
997    2
998    2
999    1
Length: 1000, dtype: int64
datosIniciales.sum(axis=1).mean()
1.654
datosIniciales.sum().sum(),datosIniciales.sum().sum()/(datosIniciales.shape[0]*datosIniciales.shape[1])
(1654, 0.1654)
1/6
0.16666666666666666
datosIniciales.mean(),datosIniciales.std()
(0    0.170
 1    0.164
 2    0.175
 3    0.158
 4    0.163
 5    0.181
 6    0.157
 7    0.171
 8    0.168
 9    0.147
 dtype: float64,
 0    0.375821
 1    0.370461
 2    0.380157
 3    0.364924
 4    0.369550
 5    0.385211
 6    0.363983
 7    0.376697
 8    0.374053
 9    0.354283
 dtype: float64)
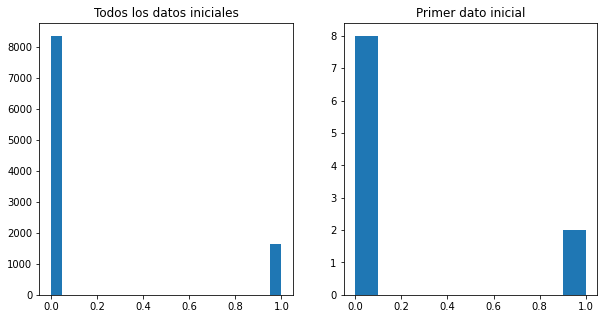
f,ax=plt.subplots(nrows=1,ncols=2,figsize=(10,5))
allDataVector = datosIniciales.to_numpy().ravel()
ax[0].hist(allDataVector,bins=20)
ax[0].set_title('Todos los datos iniciales')
ax[1].hist(datosIniciales.loc[0])
ax[1].set_title('Primer dato inicial')
plt.show()
f,ax=plt.subplots(nrows=1,ncols=1,figsize=(5,5))
datosIniciales[:10].plot.bar(stacked=True,ax=ax)
<AxesSubplot:>
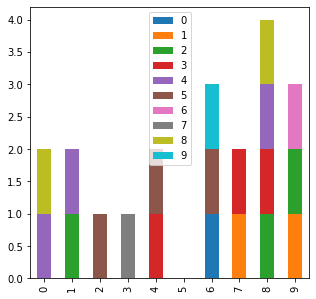
datosIniciales[:10]
| 0 | 1 | 2 | 3 | 4 | 5 | 6 | 7 | 8 | 9 | |
|---|---|---|---|---|---|---|---|---|---|---|
| 0 | 0 | 0 | 0 | 0 | 1 | 0 | 0 | 0 | 1 | 0 |
| 1 | 0 | 0 | 1 | 0 | 1 | 0 | 0 | 0 | 0 | 0 |
| 2 | 0 | 0 | 0 | 0 | 0 | 1 | 0 | 0 | 0 | 0 |
| 3 | 0 | 0 | 0 | 0 | 0 | 0 | 0 | 1 | 0 | 0 |
| 4 | 0 | 0 | 0 | 1 | 0 | 1 | 0 | 0 | 0 | 0 |
| 5 | 0 | 0 | 0 | 0 | 0 | 0 | 0 | 0 | 0 | 0 |
| 6 | 1 | 0 | 0 | 0 | 0 | 1 | 0 | 0 | 0 | 1 |
| 7 | 0 | 1 | 0 | 1 | 0 | 0 | 0 | 0 | 0 | 0 |
| 8 | 0 | 0 | 1 | 1 | 1 | 0 | 0 | 0 | 1 | 0 |
| 9 | 0 | 1 | 1 | 0 | 0 | 0 | 1 | 0 | 0 | 0 |
f,ax=plt.subplots(nrows=1,ncols=1,figsize=(30,15))
datosIniciales.plot.bar(stacked=True,ax=ax,legend=False,xticks=[])
<AxesSubplot:>
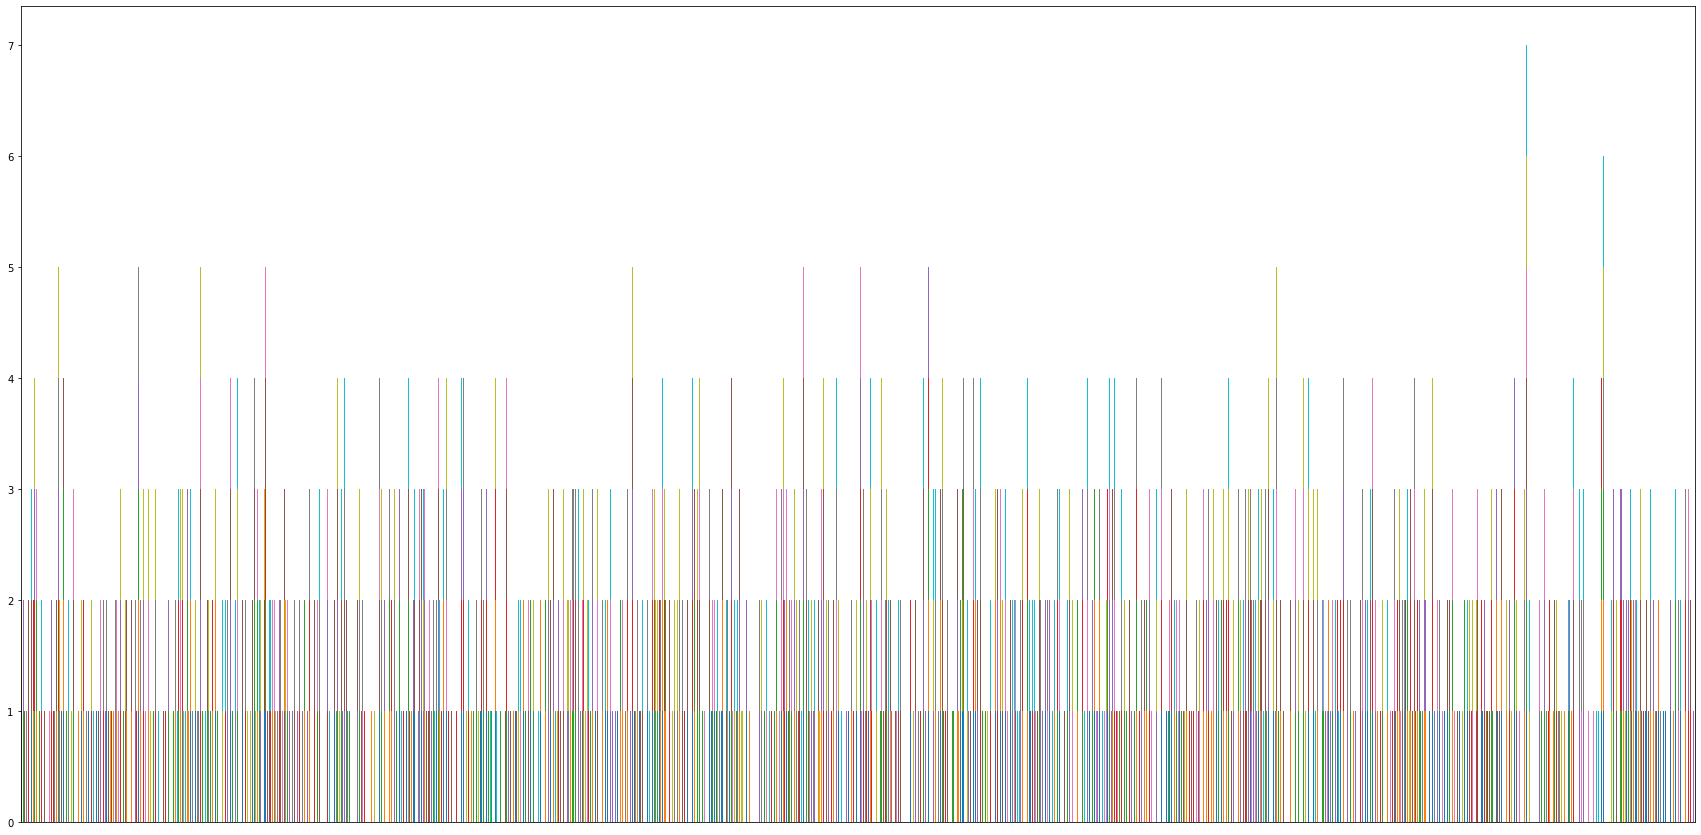
datosIniciales.sum(axis=1).max()
7
datosIniciales.sum(axis=1).argmax()
899
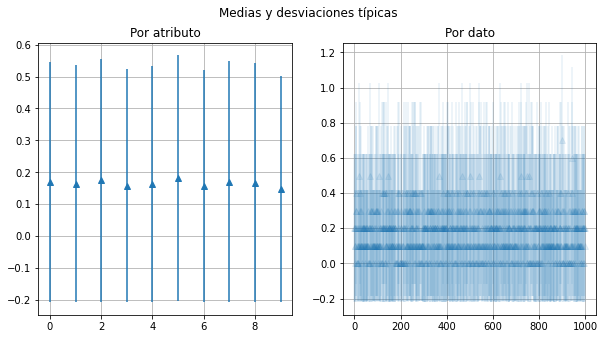
Medias y varianzas de los datos
Por atributo
Por dato
f,ax=plt.subplots(nrows=1,ncols=2,figsize=(10,5))
x=np.arange(nd)
ax[0].errorbar(x,datosIniciales.mean(),datosIniciales.std(),linestyle='None', marker='^')
ax[0].grid()
ax[0].set_title('Por atributo')
x = np.arange(ni)
ax[1].errorbar(x,datosIniciales.mean(axis=1),datosIniciales.std(axis=1),linestyle='None', marker='^',alpha=0.1)
ax[1].grid()
ax[1].set_title('Por dato')
f.suptitle('Medias y desviaciones típicas')
Text(0.5, 0.98, 'Medias y desviaciones típicas')
datosIniciales.std(axis=1).min(),datosIniciales.std(axis=1).max()
(0.0, 0.5270462766947299)
Inicialización del SOM
En el siguiente paso definimos la red neuronal (número de neuronas, \(neu\)) y asignamos valores a los vectores de referencia asociados a cada neurona, con igual dimensión que las instancias, \(n_d\).
Esta asignación se realiza aleatoriamente y, en la medida de lo posible, debería tener en cuenta la forma de los datos que se van a analizar.
neu = 25

W = np.random.uniform(low=0.0,high=1.0,size=(neu,nd))
Wdf = pd.DataFrame(W)
Wdf.head()
| 0 | 1 | 2 | 3 | 4 | 5 | 6 | 7 | 8 | 9 | |
|---|---|---|---|---|---|---|---|---|---|---|
| 0 | 0.148685 | 0.370841 | 0.184733 | 0.749099 | 0.007917 | 0.184030 | 0.667854 | 0.160759 | 0.986918 | 0.829111 |
| 1 | 0.520860 | 0.795182 | 0.153967 | 0.727310 | 0.785317 | 0.551584 | 0.967120 | 0.232116 | 0.345371 | 0.630668 |
| 2 | 0.601565 | 0.728458 | 0.274392 | 0.270818 | 0.347836 | 0.635919 | 0.845812 | 0.678168 | 0.878340 | 0.347185 |
| 3 | 0.520391 | 0.224230 | 0.451925 | 0.972503 | 0.989422 | 0.708267 | 0.887773 | 0.916554 | 0.035603 | 0.847045 |
| 4 | 0.675417 | 0.933550 | 0.028215 | 0.869037 | 0.794171 | 0.545601 | 0.908379 | 0.029695 | 0.256279 | 0.417193 |
Cuarto atributo
Wdf.loc[:,4]
0     0.007917
1     0.785317
2     0.347836
3     0.989422
4     0.794171
5     0.697154
6     0.530202
7     0.813474
8     0.276522
9     0.747090
10    0.974602
11    0.023663
12    0.648431
13    0.472759
14    0.775001
15    0.429152
16    0.408939
17    0.388444
18    0.269030
19    0.127187
20    0.537846
21    0.357911
22    0.370094
23    0.283539
24    0.697622
Name: 4, dtype: float64
Cuarta neurona
Wdf.loc[4,:]
0    0.675417
1    0.933550
2    0.028215
3    0.869037
4    0.794171
5    0.545601
6    0.908379
7    0.029695
8    0.256279
9    0.417193
Name: 4, dtype: float64
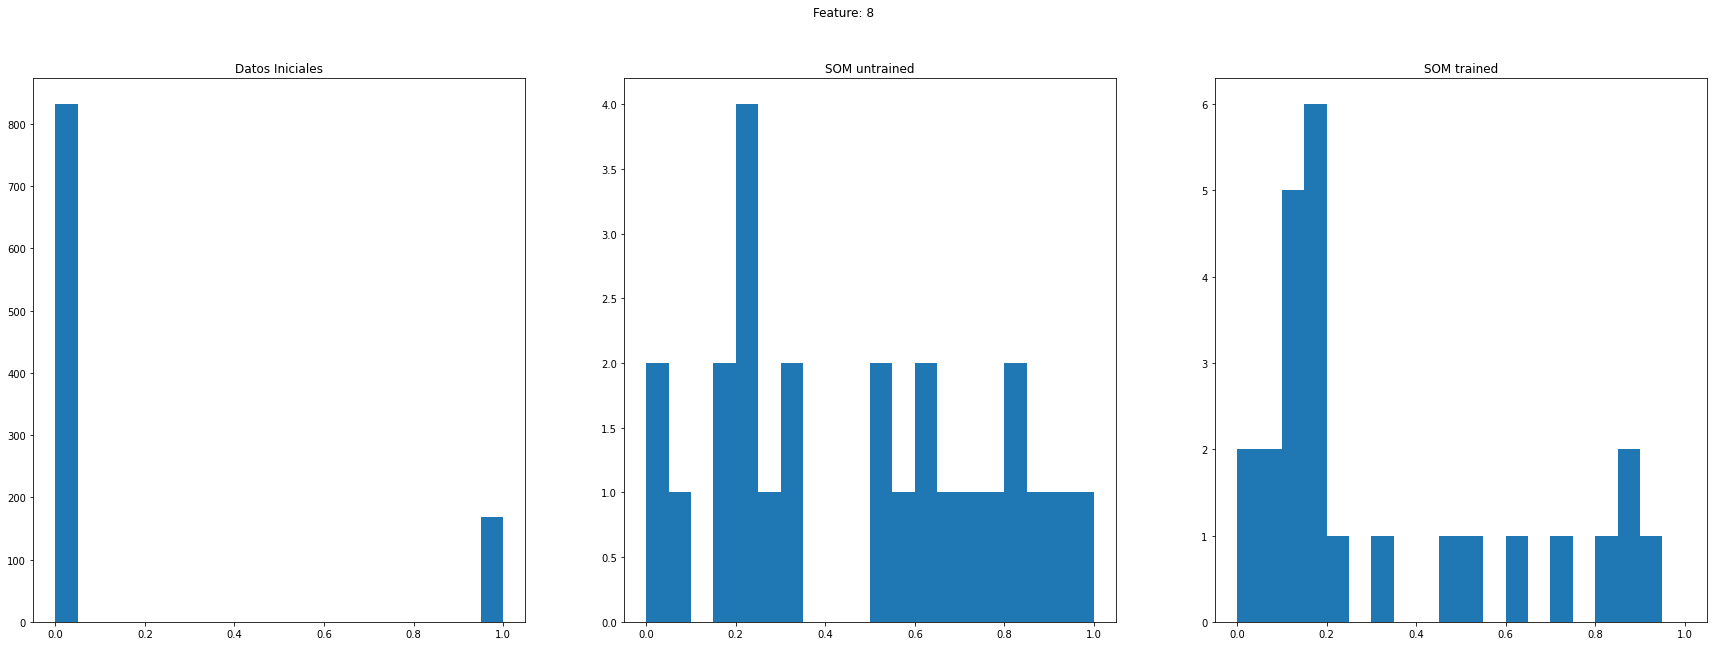
Tenemos 10 features/atributos. En los datos éstas toman valores en el conjunto \(\{0,1\}\), mientras que en las neuronas, los pesos toman valores en el intervalo \([0,1]\). Hacemos un histograma de cómo se distribuyen tanto en los datos como en la red neuronal. Tomamos un feature al azar.
Wdf.shape
(25, 10)
Histogramas
Todos los valores
Un feature aleatorio
Un dato vs una neurona aleatorios
f,ax=plt.subplots(nrows=1,ncols=2,figsize=(10,5))
allDataVector = datosIniciales.to_numpy().ravel()
ax[0].hist(allDataVector,bins=20,range=[0,1])
ax[0].set_title('Datos iniciales')
allWVector = Wdf.to_numpy().ravel()
ax[1].hist(allWVector,bins=40,range=[0,1])
ax[1].set_title('SOM inicial')
f.suptitle('Histogramas')
plt.show()
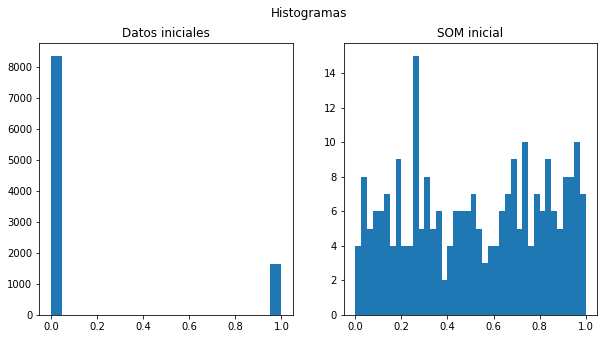
allWVector[:5]
array([0.14868463, 0.37084127, 0.18473303, 0.74909867, 0.00791715])
Histograma por feature/atributo
feature = np.random.choice(nd)
datosInicialesFeature = datosIniciales.loc[:,feature]
datosNeuronaFeature = Wdf.loc[:,feature]
f,ax = plt.subplots(nrows=1,ncols=2,figsize=(10,5))
datosInicialesFeature.hist(ax=ax[0],range=[0,1])
datosNeuronaFeature.hist(ax=ax[1],range=[0,1])
ax[0].set_title('Datos iniciales')
ax[1].set_title('SOM inicial')
plt.show()
print('Feature: ',feature)
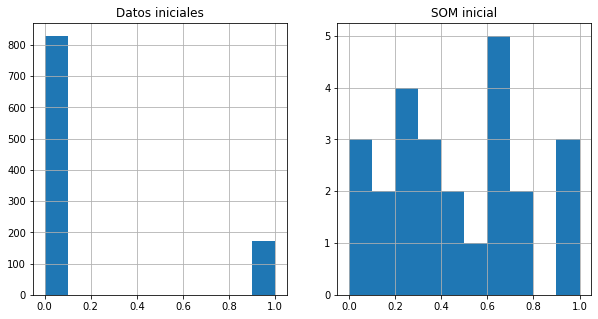
Feature: 7
Histograma de dato/neurona individual
neurona = np.random.choice(neu)
dato = np.random.choice(ni)
datosInicialesDato = datosIniciales.loc[dato,:]
datosNeurona = Wdf.loc[neurona,:]
f,ax = plt.subplots(nrows=1,ncols=2,figsize=(10,5))
datosInicialesDato.hist(ax=ax[0],range=[0,1])
datosNeurona.hist(ax=ax[1],range=[0,1])
ax[0].set_title('Dato')
ax[1].set_title('Neurona')
plt.show()
print('Dato: {}\nNeurona: {}'.format(dato,neurona))
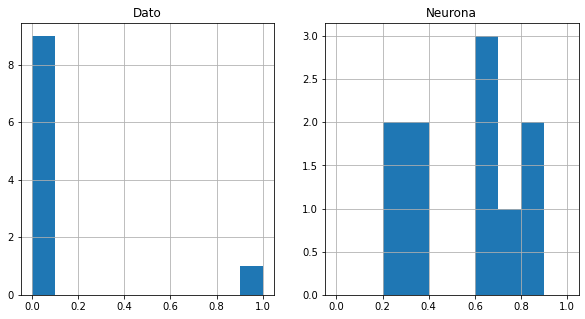
Dato: 969
Neurona: 2
Medias y varianzas de las neuronas
f,ax=plt.subplots(nrows=1,ncols=2,figsize=(10,5))
x=np.arange(nd)
ax[0].errorbar(x,Wdf.mean(),Wdf.std(),linestyle='None', marker='^')
ax[0].grid()
x = np.arange(neu)
ax[1].errorbar(x,Wdf.mean(axis=1),Wdf.std(axis=1),linestyle='None', marker='^',alpha=0.1)
ax[1].grid()
ax[0].set_title('Por atributo')
ax[1].set_title('Por neurona')
Text(0.5, 1.0, 'Por neurona')
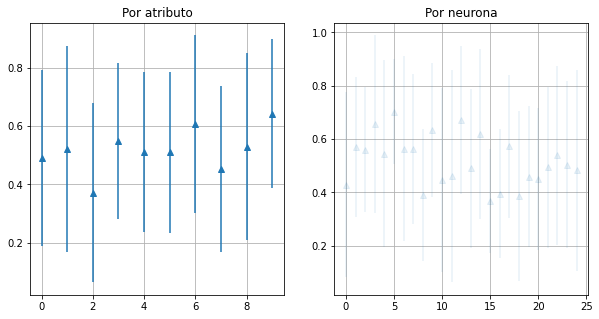
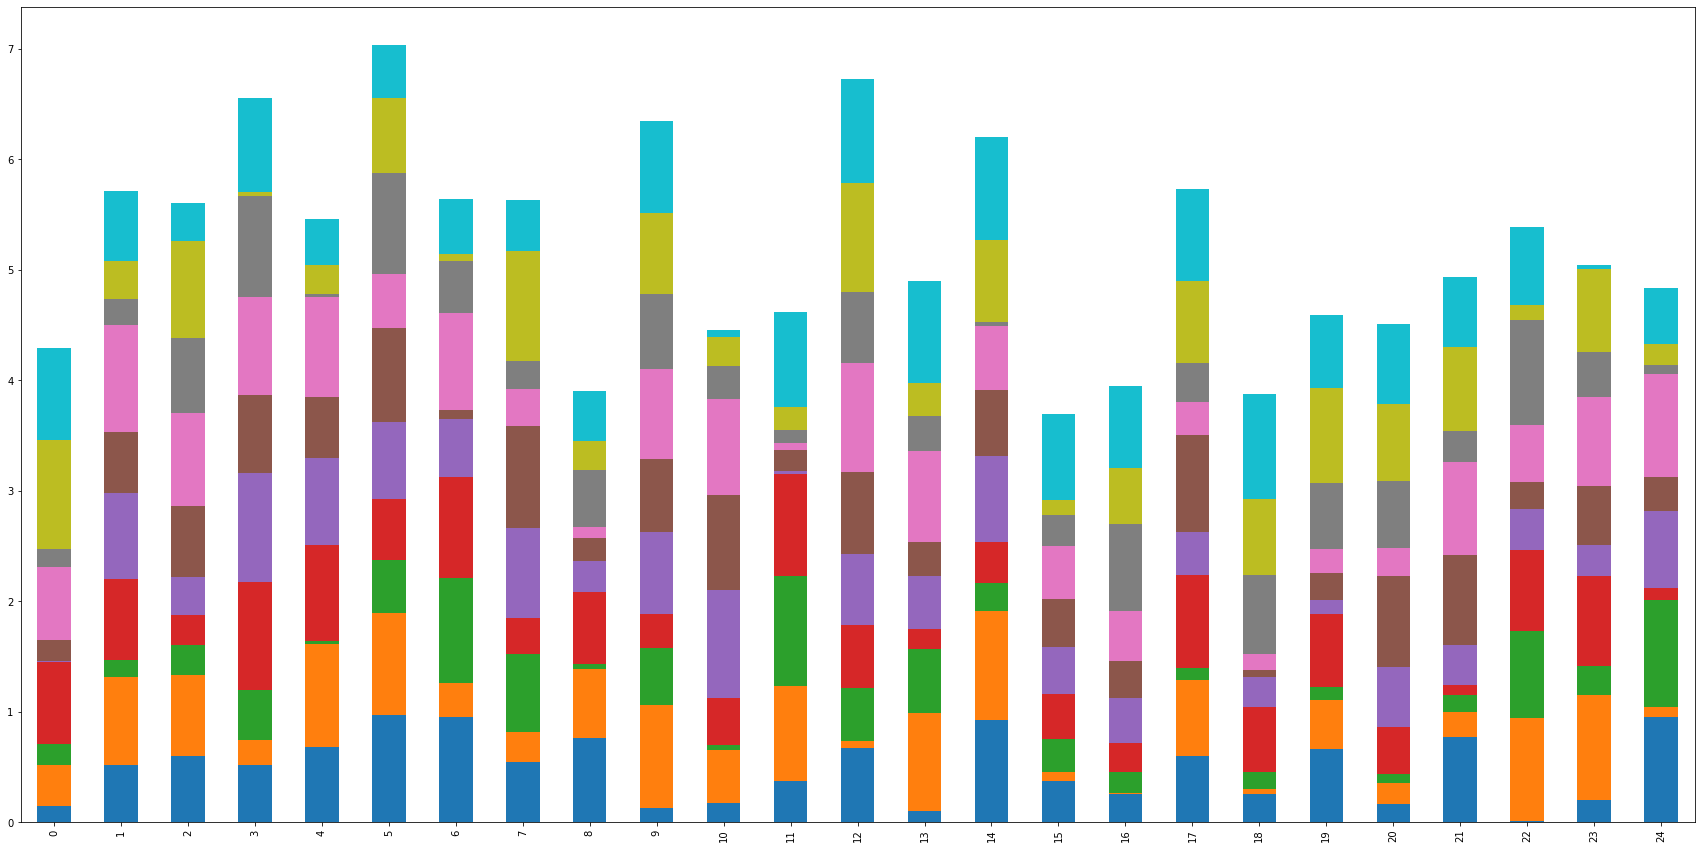
Stacked barplot de las neuronas del SOM en su estado inicial
f,ax=plt.subplots(nrows=1,ncols=1,figsize=(30,15))
Wdf.plot.bar(stacked=True,ax=ax,legend=False)
<AxesSubplot:>
Funciones de núcleo de entorno
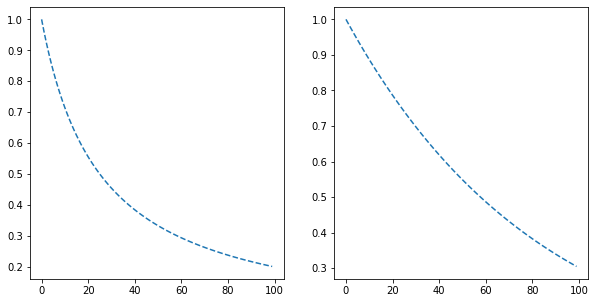
En la actualización de los vectores de referencia de las neuronas se utiliza un núcleo de entorno (neighborhood kernel), \(h_{ci}\), que modifica el entorno de vectores cercanos a la BMU. En este núcleo aparecen las funciones de la tasa de aprendizaje \(\alpha\) y de varianza \(\sigma\). Una sencilla elección es la siguiente:
# graficamos las elecciones
kk = np.arange(0,100)
def alpha(k):
    s = k/(neu)
    return 1/(1+s)
def sigma(k):
    s=k/neu
    return np.exp(-0.3*s)
f,ax=plt.subplots(nrows=1,ncols=2,figsize=(10,5))
ax[0].plot(kk,alpha(kk),'--',label=r'$\alpha(k)$')
ax[1].plot(kk,sigma(kk),'--',label=r'$\sigma(k)$')
[<matplotlib.lines.Line2D at 0x7f46e803cc70>]
Elección de la Best Matching Unit(BMU) y Actualización
Para cada instancia que se presenta al SOM se elige una neurona cuyo vector de referencia cumpla una condición de mínimo, en concreto, de mínima distancia euclídea. Una vez hecha esta elección, los vectores de referencia se van actualizando a medida que las instancias son procesadas por la red auto-organizativa.
Esta actualización se lleva a cabo mediante la fórmula de Kohonen con un núcleo de entorno exponencial.
def BMU(dato,SOM):
    distancias = []
    for ii in np.arange(neu):
        neurona = SOM.loc[ii].to_numpy()
        dist = np.sqrt(np.sum(((dato-neurona)**2)))
        distancias.append(dist)
    # seleccionamos la menor

    menorPosicion = np.argmin(np.asarray(distancias))
    return menorPosicion

def actualizarPesos(dato,SOM,posicionBMU,itt):
    '''
    itt: iteracion
    '''
    Vk = []
    for k in np.arange(neu):
        kernel = np.exp(-((posicionBMU-k)**2)/(2*sigma(i)**2))
        SOM.loc[k] = SOM.loc[k]+alpha(itt)*kernel*(dato-SOM.loc[k])
        Vk.append(np.sqrt(np.sum((SOM.loc[posicionBMU]-SOM.loc[k])**2)))
    Vmeanitt = np.mean(Vk)
    return SOM,Vmeanitt

def crearSOM():
    W = np.random.uniform(low=0.0,high=1.0,size=(neu,nd))
    Wdf = pd.DataFrame(W)
    return Wdf
#neu = 25
#ni = 1000
#nd = 10

Vm = []
Tm = []
Tvar = []
Bm = []
Bvar = []
closesdist = []

SOM = crearSOM()
SOMinit = SOM.copy()
for ii in np.arange(ni):
    if ii%100==0:
        print('Etapa:',ii)
    dato = datosIniciales.loc[ii].to_numpy()
    posicionBMU = BMU(dato,SOM)
    cd = np.sqrt(np.sum((dato-SOM.loc[posicionBMU])**2))
    closesdist.append(cd)
    #print(ii,posicionBMU)
    SOM,Vmeanitt = actualizarPesos(dato,SOM,posicionBMU,ii)
    Vm.append(Vmeanitt)
    Tm.append(SOM.to_numpy().ravel().mean())
    Tvar.append(SOM.to_numpy().ravel().std())
    Bm.append(SOM.loc[posicionBMU].to_numpy().mean())
    Bvar.append(SOM.loc[posicionBMU].to_numpy().std())
print('Finished')
Etapa: 0
Etapa: 100
Etapa: 200
Etapa: 300
Etapa: 400
Etapa: 500
Etapa: 600
Etapa: 700
Etapa: 800
Etapa: 900
Finished
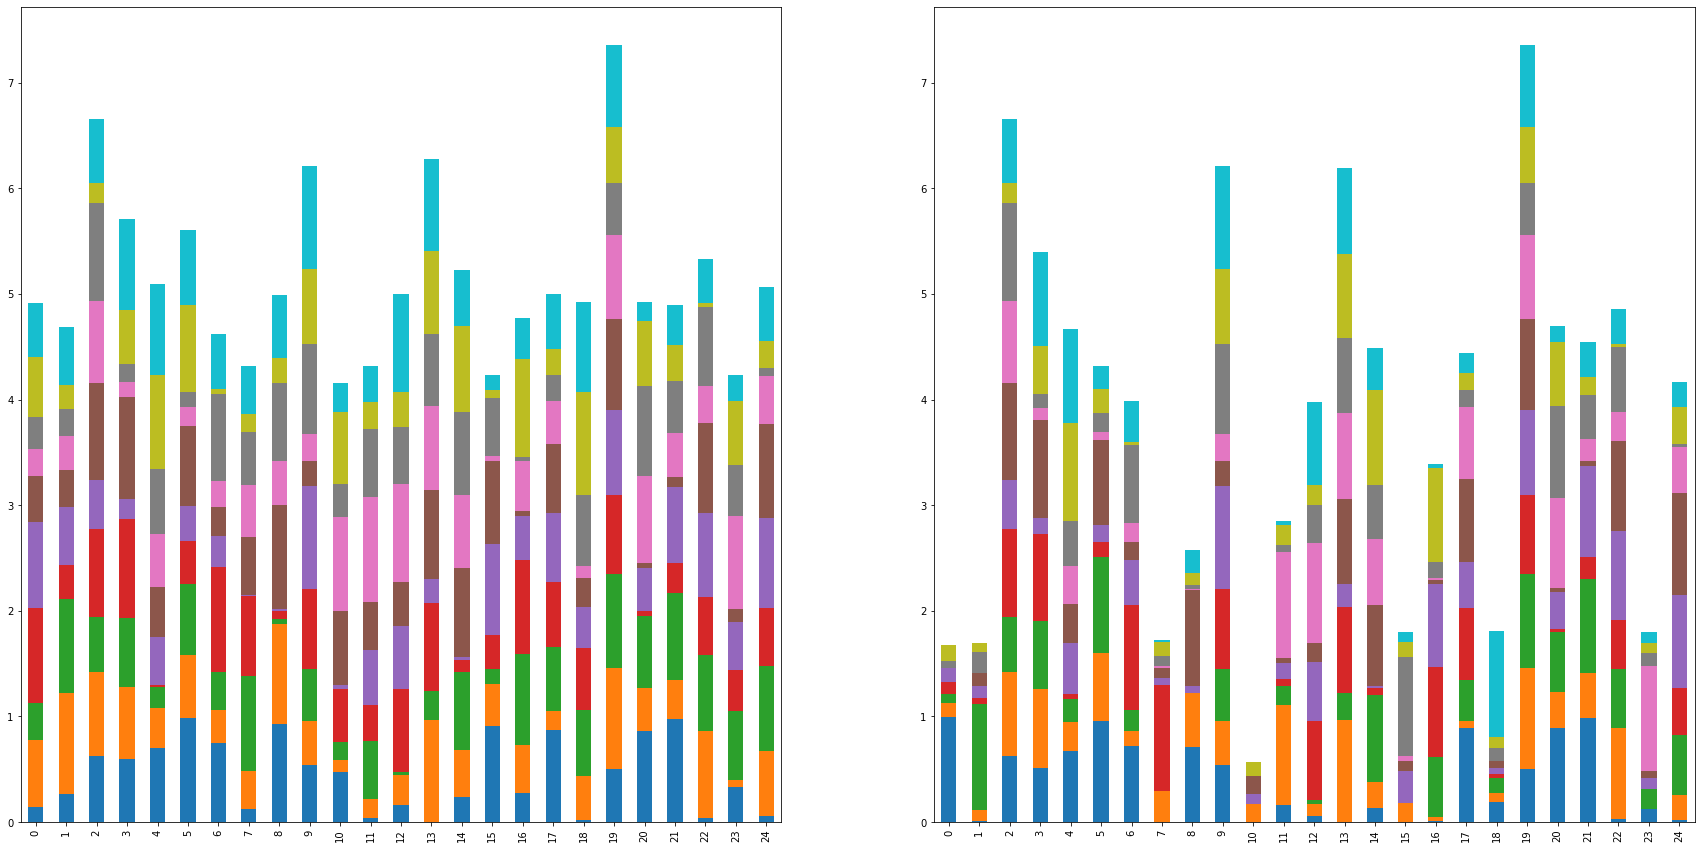
Comparación de barplots
f,ax=plt.subplots(nrows=1,ncols=2,figsize=(30,15))
SOMinit.plot.bar(stacked=True,ax=ax[0],legend=False)
SOM.plot.bar(stacked=True,ax=ax[1],legend=False)
<AxesSubplot:>
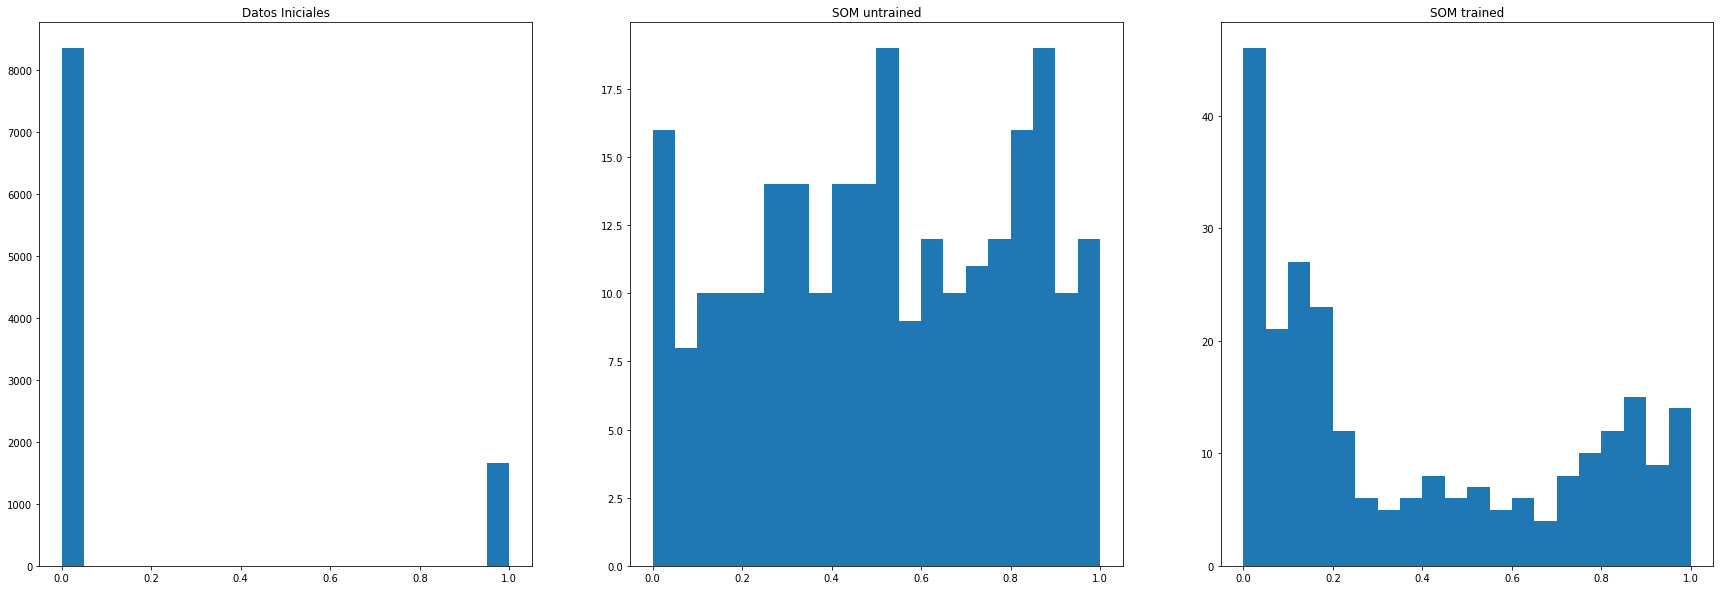
Comparación de histogramas
f,ax=plt.subplots(nrows=1,ncols=3,figsize=(30,10))
ax[0].hist(datosIniciales.to_numpy().ravel(),range=[0,1],bins=20)
ax[0].set_title('Datos Iniciales')
ax[1].hist(SOMinit.to_numpy().ravel(),range=[0,1],bins=20)
ax[1].set_title('SOM untrained')
ax[2].hist(SOM.to_numpy().ravel(),range=[0,1],bins=20)
ax[2].set_title('SOM trained')
plt.plot()
[]
Histogramas de un feature
feature  = np.random.choice(nd)
f,ax=plt.subplots(nrows=1,ncols=3,figsize=(30,10))
ax[0].hist(datosIniciales.loc[:,feature].to_numpy().ravel(),range=[0,1],bins=20)
ax[0].set_title('Datos Iniciales')
ax[1].hist(SOMinit.loc[:,feature].to_numpy().ravel(),range=[0,1],bins=20)
ax[1].set_title('SOM untrained')
ax[2].hist(SOM.loc[:,feature].to_numpy().ravel(),range=[0,1],bins=20)
ax[2].set_title('SOM trained')
f.suptitle('Feature: {}'.format(feature))
plt.plot()
[]
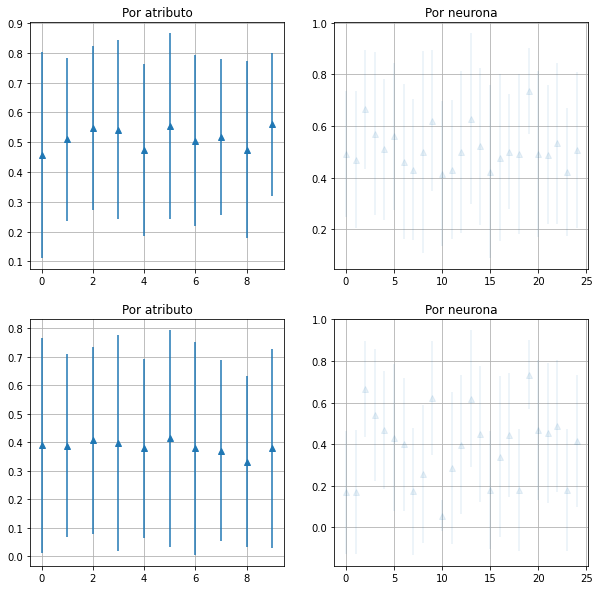
f,ax=plt.subplots(nrows=2,ncols=2,figsize=(10,10))
x=np.arange(nd)
ax[0,0].errorbar(x,SOMinit.mean(),SOMinit.std(),linestyle='None', marker='^')
ax[0,0].grid()
ax[0,0].set_title('Por atributo')
ax[1,0].errorbar(x,SOM.mean(),SOM.std(),linestyle='None', marker='^')
ax[1,0].grid()
ax[1,0].set_title('Por atributo')

x = np.arange(neu)
ax[0,1].errorbar(x,SOMinit.mean(axis=1),SOMinit.std(axis=1),linestyle='None', marker='^',alpha=0.1)
ax[0,1].grid()
ax[0,1].set_title('Por neurona')
ax[1,1].errorbar(x,SOM.mean(axis=1),SOM.std(axis=1),linestyle='None', marker='^',alpha=0.1)
ax[1,1].grid()
ax[1,1].set_title('Por neurona')
Text(0.5, 1.0, 'Por neurona')
Asociar datos a neuronas
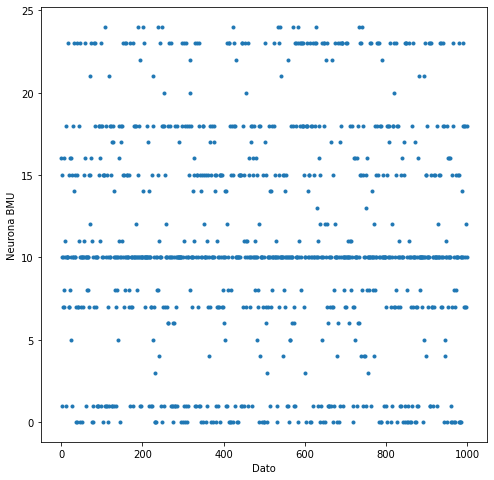
BMUV = []
for ii in range(ni):
    dato = datosIniciales.loc[ii]
    posicionBMU = BMU(dato,SOM)
    BMUV.append(posicionBMU)
f,ax=plt.subplots(nrows=1,ncols=1,figsize=(8,8))
plt.plot(range(ni),BMUV,'.')
plt.xlabel('Dato')
plt.ylabel('Neurona BMU')
Text(0, 0.5, 'Neurona BMU')
Gráficas de evolucion
datosIniciales.to_numpy().ravel().mean(),datosIniciales.to_numpy().ravel().std()
(0.1654, 0.37154116864756725)
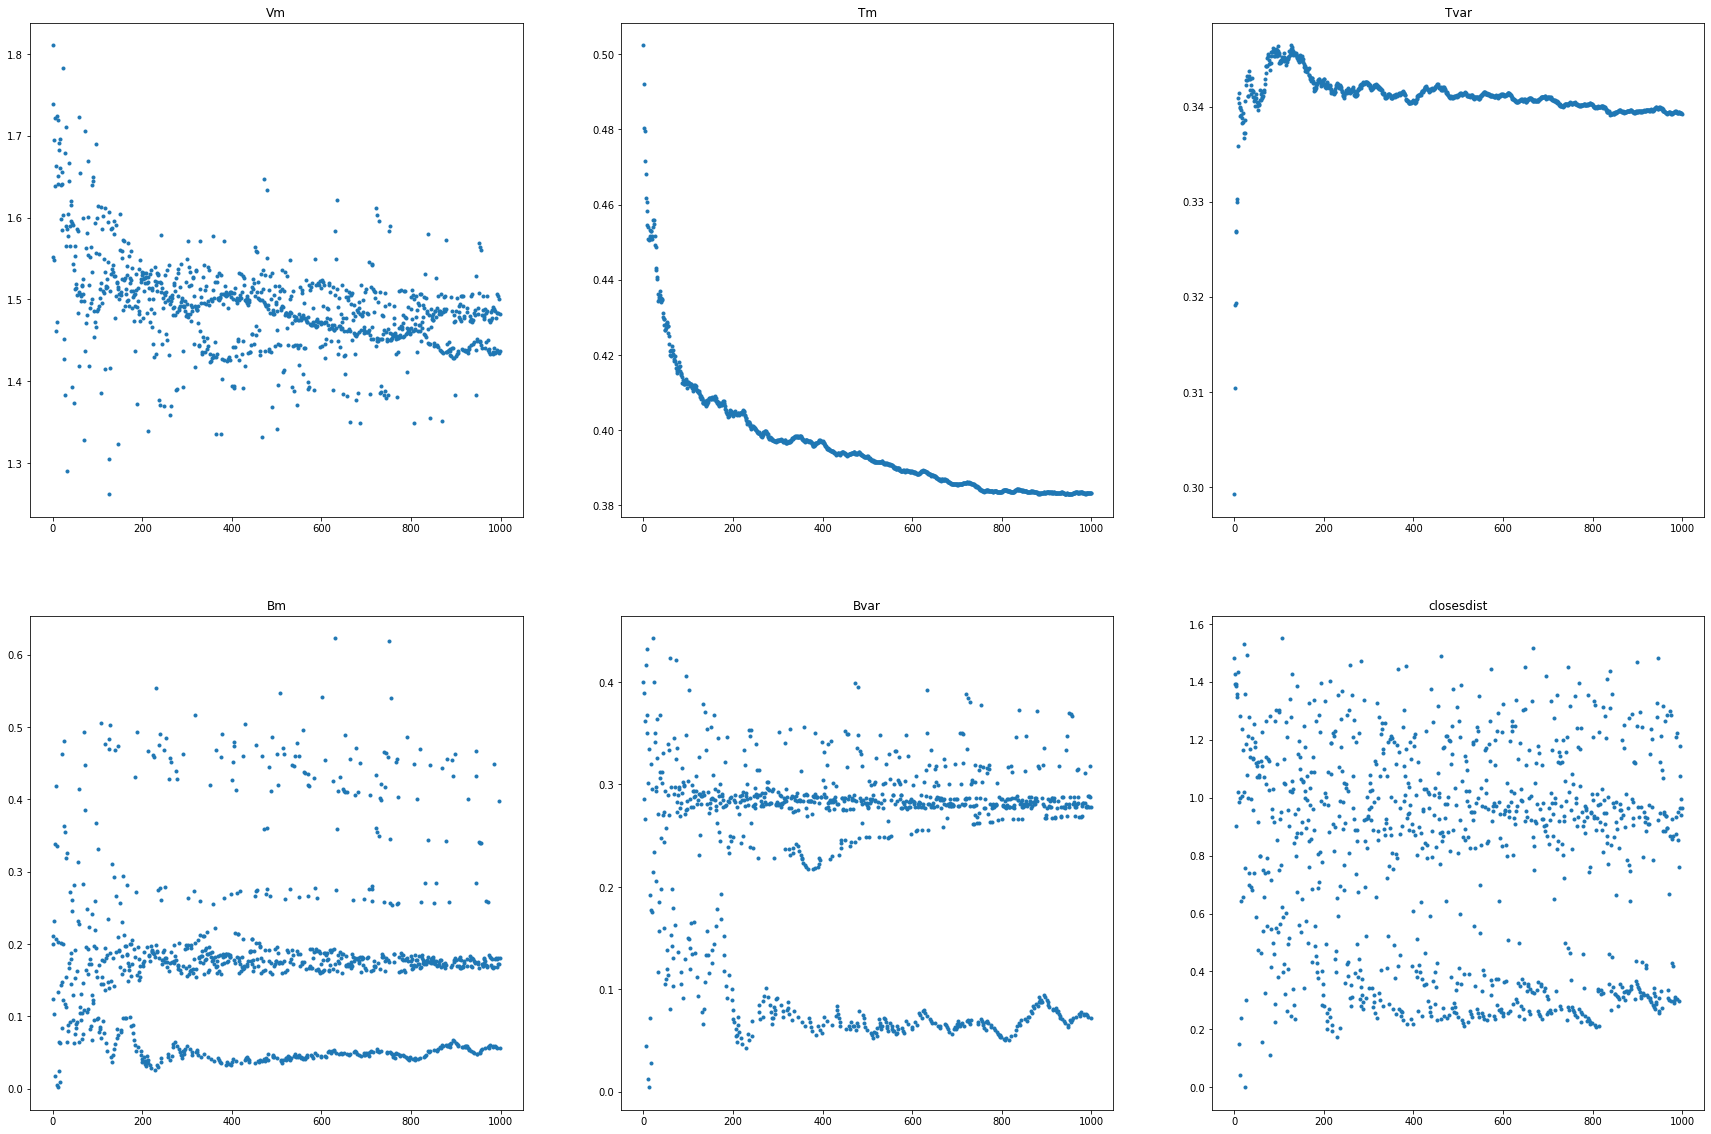
xx = np.arange(ni)
f,axes=plt.subplots(nrows=2,ncols=3,figsize=(30,20))
ax=axes.ravel()
ax[0].plot(xx,Vm,'.')
ax[0].set_title('Vm')
ax[1].plot(xx,Tm,'.')
ax[1].set_title('Tm')
ax[2].plot(xx,Tvar,'.')
ax[2].set_title('Tvar')
ax[3].plot(xx,Bm,'.')
ax[3].set_title('Bm')
ax[4].plot(xx,Bvar,'.')
ax[4].set_title('Bvar')
ax[5].plot(xx,closesdist,'.')
ax[5].set_title('closesdist')
Text(0.5, 1.0, 'closesdist')
Ejercicios
Realiza un entrenamiento SOM con varias épocas de aprendizaje
Aleatoriza la entrada de los datos al proceso de aprendizaje
Varía los parámetros de aprendizaje
Compara los resultados
Comenta las gráficas
